This post analyses the values of 17 Marketplace companies listed on different European stock exchanges. The Marketplace sector is a sector with great growth in recent years and that, in the year 2021, driven by the pandemic, has increased the sector's operations and its growth in a big way. We have been able to see much more in-depth data in the Marketplace companies report prepared by our MarketResearch department.
In this article, we will show the main variables to be taken into account for the valuation of companies and, on the other hand, the analysis of valuation by multiples.
Analysis of the main variables
Revenue growth
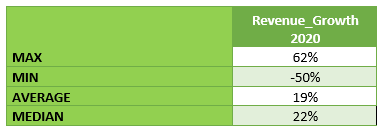
As shown in the graph, most of the Marketplace companies studied have double-digit revenue growth compared to last year, with the maximum being 62% growth. On the other hand, the minimum is -50%, belonging to Opendoor company that in 2019 had an increase in sales with respect to 2019 of 164.1%, a number difficult to maintain. This company is dedicated to online transactions in residential real estate. The maximum is a growth of 62% and has been realised by Fiverr, an Israeli company that provides a platform for freelancers to offer services to clients all over the world.

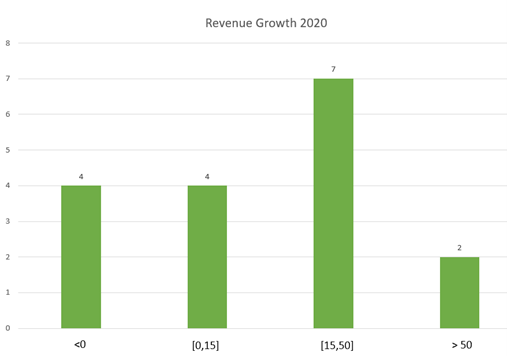
The mean and median have similar values, both being close to 20% indicating that most Marketplace companies are growing at double digits.
Profitability
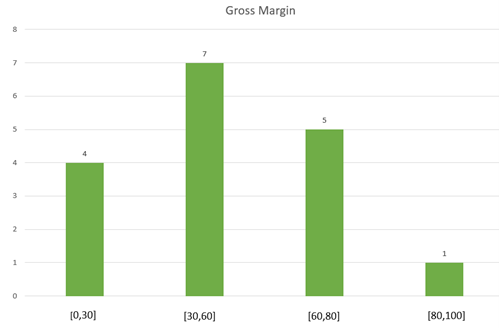
The gross margin shows that companies are mostly profitable with an average percentage of 43%. These are not as high gross margin values as other sectors, Cloud Computing for example, may have. In other words, these companies earn less revenue per sale they make than other types of sectors, without taking away from the fact that they are still attractive numbers.
With regard to the EBITDA margin (EBITDA to revenue), it shows that almost 60% of all the companies studied have a negative EBITDA. The average is -128%, as there is a very small outlayer of -2007% since the EBITDA of this company (NextPlay Technologies) is -8.23 and its revenue is 0.41.
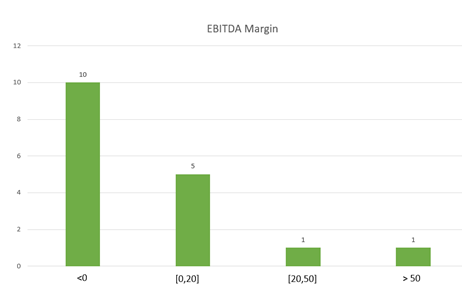
The company with the highest EBITDA margin is FlexShopper, a US company that offers consumers certain types of durable goods on a lease-purchase basis and, in addition to being listed on NASDAQ, is listed on the Frankfurt Stock Exchange.

Valuation analysis by multiples
EV/Revenues vs EV/EBITDA
In general, the EV/EBITDA multiple is usually more meaningful than the EV/revenue multiple because it shows less dispersion. In this case, EV/EBITDA cannot be used as a benchmark, as almost 60% of marketplace companies have a negative EBITDA and, as shown in the table, too low an outlayer. We will therefore use the EV/revenue multiple, which is more characteristic in this case.
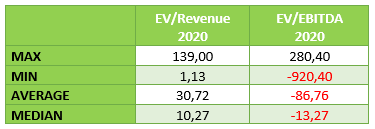
Most companies in the marketplace sector have an enterprise value to revenue ratio between 3 and 10, indicating that sales are higher than enterprise value. The most reliable ratio is provided by the median since the maximum is a very high value, as will be shown later.
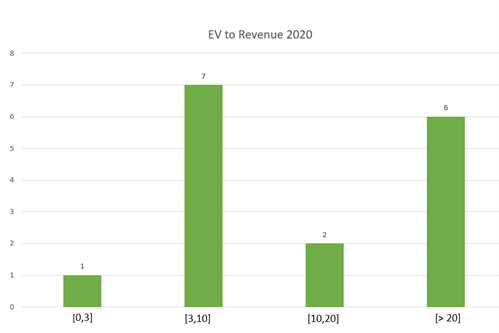
In turn, the maximum multiple is 139 times, a very high value. It is owned by the US company HyreCar, which offers a peer-to-peer car-sharing platform that allows anyone to rent their idle cars to Uber and Lyft drivers in a safe and reliable way.

Annual valuation performance by multiples 2020 vs 2019

As explained above, the most significant ratio for valuation purposes is the revenue ratio, as EBITDA values have numerous outliers.
Looking at the EV/Revenues, we can conclude that the evolution is positive. It grows in all 4 variables, but focusing above all on the median (the most significant variable as we have seen above), the ratio grows by almost 7.
Final conclusions
Business growth:
The companies studied in the sector have ceased the strong growth experienced in the previous year, but are still growing compared to the previous year

Benefit:
The gross margins of marketplace companies are not as high as in other technology sectors, but they are close to 50%, which is not bad. On the other hand, EBITDA margins are mostly negative, which may indicate that companies are seeking to consolidate by combining high growth with negative margins.
EV/Revenue evolution:
Large growth in this multiple from x4 to x10.
