Based on key variables and the valuation by multiples of a companyWe are going to analyse the values of 17 Cloud Computing companies listed on different European stock exchanges. This Cloud Computing sector is a sector with great growth in recent years and which has started to consolidate as shown in the analysis conducted by Baker Tilly.
In this article, we will show the main variables to be taken into account for the valuation of companies and, on the other hand, the analysis of the valuation by multiples of a company.
Analysis of the main variables
Revenue growth
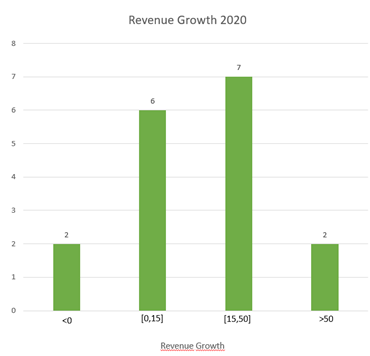
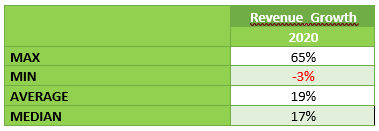
As the graph shows, most of the companies studied have double-digit revenue growth over last year, with the maximum being 65% of growth. On the other hand, the minimum is -3%, not a bad number at all as in this case, it represents the growth of Rosslyn Data Technologies, a London-based software company offering data acquisition and management solutions, which had a big growth in 2018 (of 104.4%), a number that is difficult to maintain.
The maximum (65%) belongs to Cloudera, a US-based software company that provides a platform for engineering and data warehousing, machine learning and analytics that runs in the cloud or on-premises.
The maximum (65%) belongs to Cloudera, a US-based software company that provides a platform for engineering and data warehousing, machine learning and analytics that runs in the cloud or on-premises.

Profitability
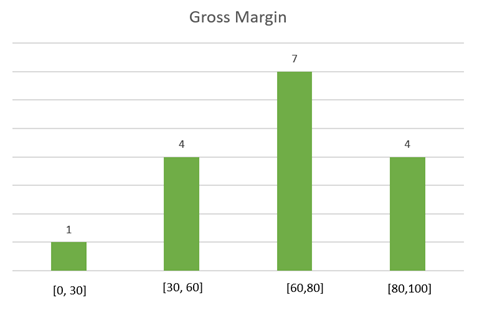
The gross margin shows that the companies are mostly profitable with a percentage higher than 60%, the average of the 17 companies being 63%.
The EBITDA margin (EBITDA to revenue) shows that one third of all the companies studied have a negative EBITDA. On the other hand, the average is positive, almost 81TP1Q, and the median is 151TP1Q, which are not insignificant values, indicating their strong performance.
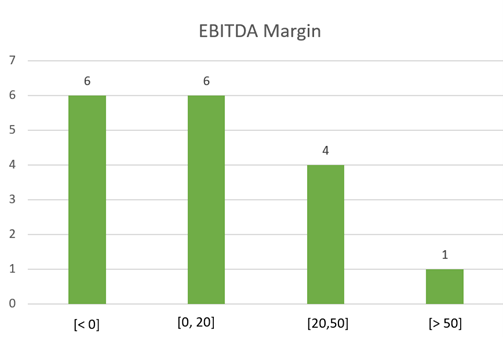
The company with the highest EBITDA margin is TeamViewera German company that offers private computer software that allows you to connect to another computer remotely.

Analysis of a company's valuation by multiples
EV/Revenues vs EV/EBITDA
In general, the EV/EBITDA multiple is usually more meaningful than the EV/revenue multiple because it shows less dispersion. In this case, EV/EBITDA cannot be used as a benchmark, as almost 30% of companies have a negative EBITDA and, as shown in the table, too low an outlayer. Therefore, we will use the more characteristic EV/revenue multiple in this case.
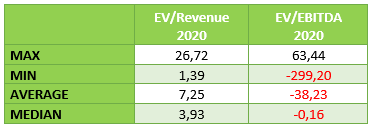
Most companies have an enterprise value to revenue ratio between 3 and 10, indicating that sales are higher than enterprise value.
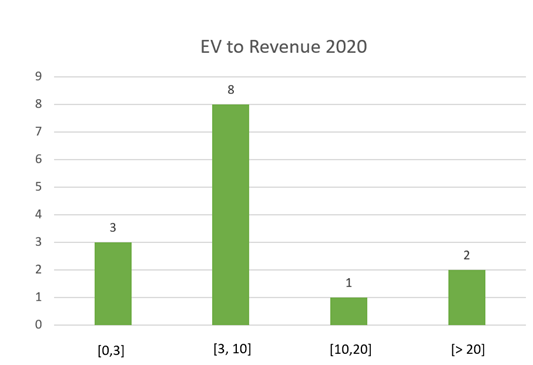
In turn, the highest multiple is almost 27 times and belongs to Coupa, a California-based company offering a global technology platform for enterprise expense management.

Annual Evolution of a company's valuation multiples 2020 vs. 2019

As explained above, the most significant ratio for valuation purposes is the revenue ratio, as EBITDA values have numerous outliers.
Therefore, looking at the EV/Revenue, we conclude that they are experiencing a small but positive growth. Although the median evolution is negative, the average, in this case very significant, is positive.
Final conclusions
Business growth:
Most companies are experiencing double digit growth. Despite this, compared to the previous year, the average, by 7%, and the median, by 9%, are down.

Benefit:
The gross margin presented by the companies is high, with an average of 63% but, on the other hand, EBITDA margins show numerous negative values, so the average is much lower, at 8%. Negative EBITDA values are present in 35% of the companies studied, which may indicate that companies seek to consolidate by combining high growth with negative margins.
EV/Revenue evolution:
Values have risen timidly but steadily, indicating the growth of the sector itself. Despite market consolidation, the market continues to grow as the multipliers do.
In this other post, we explain you more details about the valuation by multiples of a company with its advantages and disadvantages.
