This post will focus on the 15 most relevant companies listed on European markets, which are within the Fintech sector. The sector has had a great growth as shown in the investment analysis carried out by our expert analysts in the sector. In this fintech analysis, we will show the main variables to be taken into account for the valuation of companies and, on the other hand, the analysis of the valuation by multiples.
Fintech analysis: key variables
Revenue growth
2020 was an exceptional year due to the COVID-19 situation, affecting many companies negatively as well as positively.
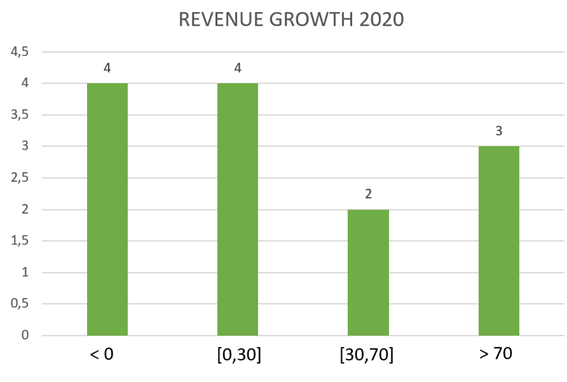
As shown in the graph below, most of the companies studied in this analysis have more than double-digit growth, with the average being very high at 42%, as there is a very high value of growth experienced by Naga, a growth of 219%. Naga is a Fintech company listed on the Frankfurt Stock Exchange that has developed an investment app, which boomed during the pandemic.

The median, on the other hand, is 15%. This is normal since, of the companies studied, 4 have experienced negative growth.
Finally, it should be noted that the 3 companies in this fintech analysis that have grown by more than 70% have very high growth rates. They are actually more than 100%.

Profitability
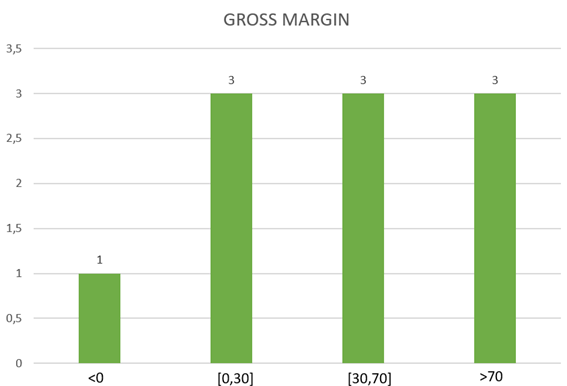
As far as profitability is concerned, the gross margin for the companies analysed shows a generally high level, with the bulk of the group having values higher than 30%.
As a profitability result, most of the companies have a positive profitability. Despite this the average is negative, due to the fact that one of the companies has a profitability of -100%, being an outlayer which greatly affects the result.
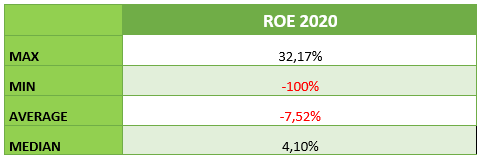
The most profitable company is Lang & Schwarz, a German company that offers a platform for trading on the stock market. It is considered the best OTC platform in the world. It is listed on Xetra, the electronic trading platform of the German Stock Exchange.
Fintech analysis: valuation by multiples
EV/Revenues vs EV/EBITDA
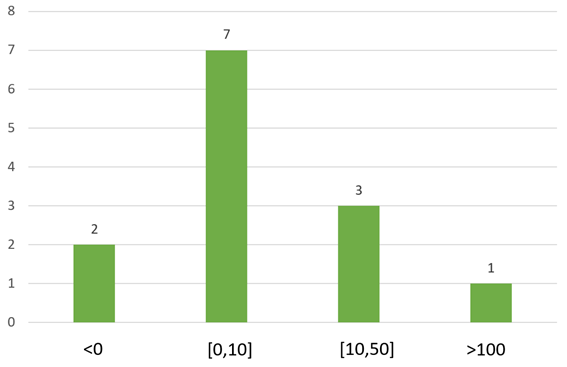
In general, the EV/EBITDA multiple is more meaningful than EV/Revenue, as it shows less dispersion. In this case, EV/EBITDA cannot be used as a benchmark, as almost 50% of the companies have a negative EBITDA. Consequently, analysing the EV/Revenues, we observe that the ratio is very high, the average being almost 20 times. While it is true that this is due to the presence of a very large ratio by MCI Capital. In the median we can observe a more significant value of 5 times.

As mentioned above, MCI Capital shows the largest ratio, an EV/Earnings of 142 times. MCI Capital is a Polish digital private equity firm that invests primarily in digital disruption, transformation and infrastructure.

Annual valuation performance by multiples 2020 vs 2019
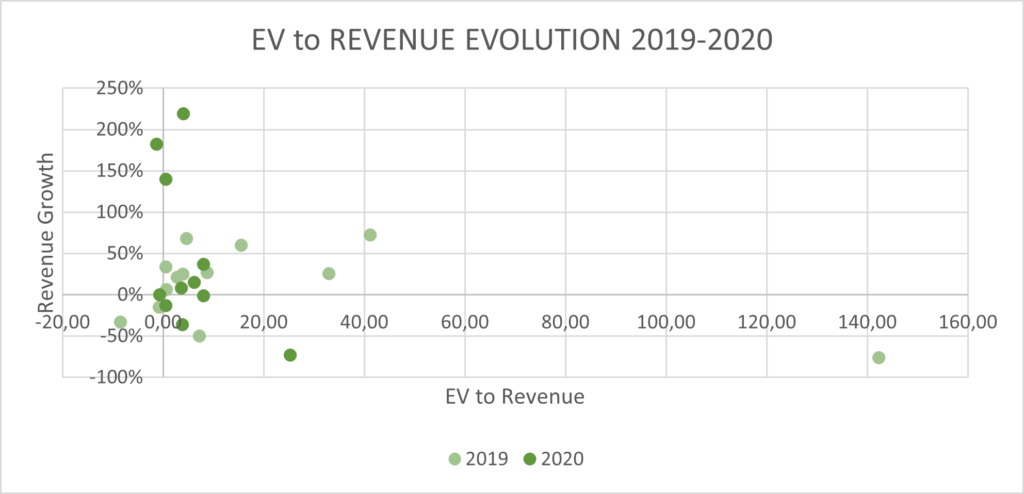
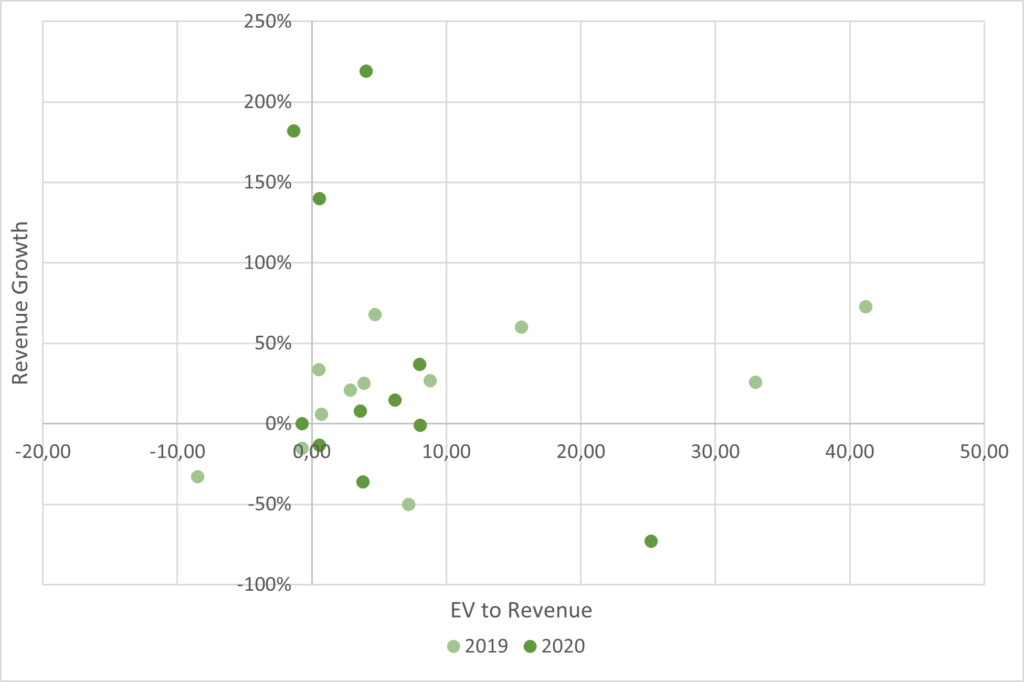
As can be seen in the scatter plot, the values do not vary much from last year if we take into account the outlayer representing MCI Capital's EV/Revenues. If we ignore this number, the evolution of the ratio can be better observed. We conclude that in 2019 there may have been higher ratios but that in 2020 they have continued, for the most part, to grow less, but positively.

Conclusions
Revenue growth:
In the fintech analysis we observe that the companies have grown by 30% on average, taking into account that there has been very large growth in the companies analysed. If we focus on the median value, the most significant value in this analysis, we observe that the value decreases by 8%. This is normal as it is difficult to maintain the growth experienced in the previous year. This does not detract from the fact that the 2020 growth is a good number.
Profitability:
The profitability shown by the companies has a negative mean, with the difference between the maximum value (not very high) and the minimum value (very low) being very large. The median indicates a positive value, indicating that most of the companies have a positive profitability.
EV/Revenues vs EV/EBITDA:
EV/Revenue values show very high values (142x), with the median value (4x) also being positive and more significant than the average (20x). Ev to EBITDA are not consistent due to the general negative EBITDA.
Evolution of Ev/Revenues and Evolution of Revenues:
As seen in the scatter plot, the 2020 values are smaller, but still positive, indicating the steady growth of the sector.
